Author Archives: Atle

Mendeley is dead, long live Zotero!

When I started out on my PhD two years ago I found Mendeley and thought it a perfect reference manager: Free to use, integrated with both MS Word and my browser and a generally easy-to-use GUI. What’s not to like?

Fast-forward two years. One of my papers was rejected and in the process of re-submitting it I needed to re-format the bibliography (more on that frustration in another post). Then Mendeley started acting up: “There was a problem setting up Word plugin communication: The address is protected”. Wtf? I re-installed the Word Plugin, I re-installed Mendeley itself, I tried some hints from this blog, I even watched a couple of YouTube videos. All to no avail. The Mendeley Word plugin did not work!

So I did what I usually do when life is mean to me: I took to Twitter. And complained. The Mendeley team was quick to answer, but their troubleshooting as nothing more than what I already had tried, plus encouraging me to “turn it off and then on again”. Nothing worked. A bit frustrated I replied:

Ok: how do I migrate my data away from Mendeley, and what is the best alternative to Mendeley?

The next day I had no reply and send a more official support request, and was met with this gem:

Dear Customer,

Thank you for submitting your question. This is to confirm that we have received your request and we aim to respond to you within 24 hours.

However, please note our current response time is 5 days.

Ok. Fuck this. I then remember hearing about Zotero, an Open Source reference manager. It seemed to offer both a Word-plugin and browser extension, as well as a method for importing my Mendeley data. Upon installation I chose “import from Mendeley” and found that it was not possible, due to encryption. I then found this site and found yet another reason to migrate away from Mendeley. Luckily my latest backup lacked only 20 items or so, so after 10 minutes of wrangling I had imported all of my data.

And I was impressed: Zotero understood that my Word doc was previously managed by Mendeley, and I did not have to change out all my references and rebuild the bibliography. So, in 30 minutes or so I had a working reference manager again, and I’ve moved from a closed platform incapable of providing adequate support to an open alternative that seems to work great!

So: if you are having trouble at all with Mendeley I would strongly suggest to migrate to Zotero!

Vsts: setting up tests and coverage to run on build for Javascript projects

I’m currently writing Javascript code, React and Redux to be more specific. After picking up the brilliant book “Human Redux” I’ve really started to enjoy this ecosystem.

But, remembering the brilliant Zombie TDD I also want to get back in the testing-game. This is quite easy when using create-react-app, as Jest is a great tool.

However, this is not the topic of this post. The topic here is how to get Microsoft VSTS (Visual Studio Team Services) to run your tests during the build phase, and report test results and coverage, and provide you with stuff like this:

2018-07-25 10_14_11-Window

coverage

You need to do stuff both to your project, and to your vsts build definition.

First off, your project:

You need the jest-junit package

npm install jest-junit -S

And, you need to edit your package.json file. First, add the top-level entry “jest”, with the following content

"jest": {
    "coverageReporters": [
      "cobertura",
      "html"
    ]
  },

and the top-level entry “jest-junit”, with the following content

"jest-junit": {
    "suiteName": "jest tests",
    "output": "test/junit.xml",
    "classNameTemplate": "{classname} - {title}",
    "titleTemplate": "{classname} - {title}",
    "ancestorSeparator": " > ",
    "usePathForSuiteName": "true"
},

Finally, you need to add the task “test:ci” to your script-block:

"test:ci": "react-scripts test --env=jsdom --testResultsProcessor=\"jest-junit\" --coverage",

So, what have we done here?

  1. We set the coverage reporters of Istanbul (which jest uses) write both the cobertura and html formats
  2. We set up jest-junit to produce junit-xml from our tests
  3. We create a test-task to be run on vsts that uses these two

You also want to add the resulting files to .gitignore

# testing
/coverage
/test

This should now work locally, test it by running

CI=true npm run test:ci
The coverage-folder should be created and the file test/junit.xml should be created.

So, everyting is good on the project side, time to move on to vsts.

Create a build, and add three tasks:

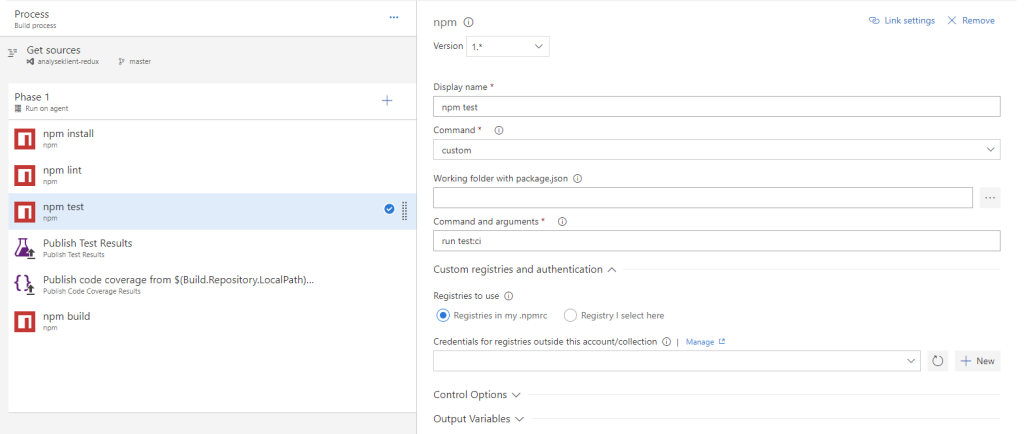
The first is an “npm” task, configure it like this
npm_test

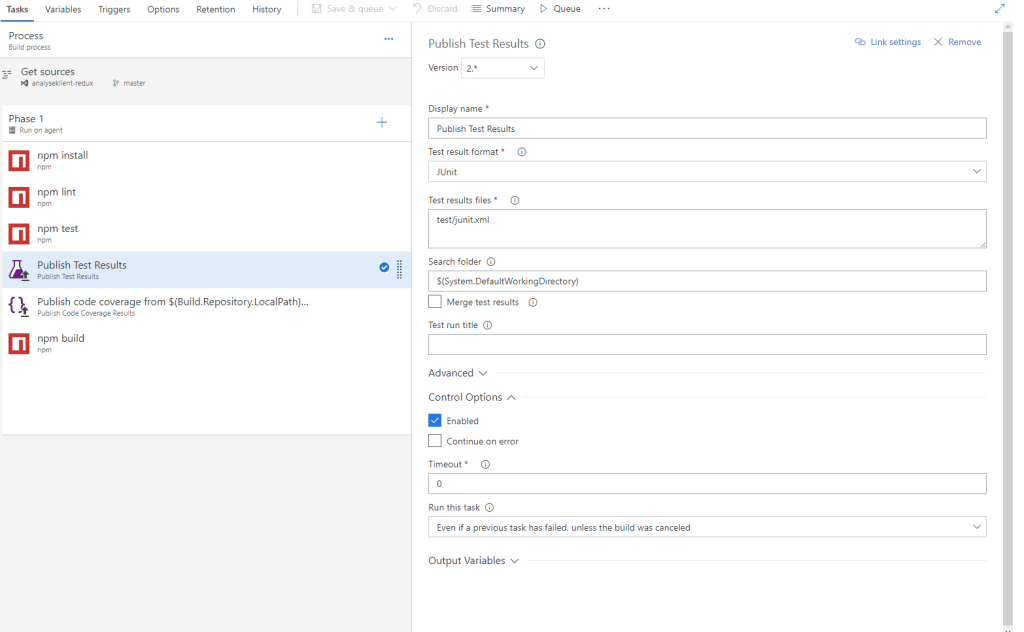
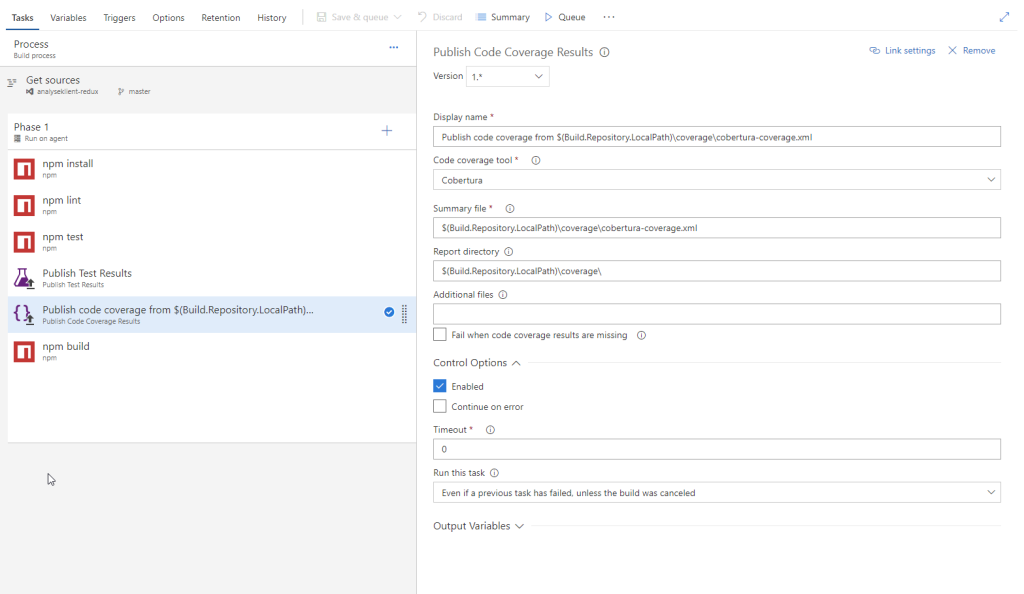
Then, you need to publish the results of the test and the coverage, so add a

“Publish Test Results” and a “Publish Code Coverage Results” task

npm_publish_test

npm_publish_coverage

Make sure you select “Even if a previous task has failed, unless the build was canceled” on the option “Run this task” under the tab “Control Options” for both publish tasks, as we want tests reports and coverage even if we have failing tests.

In addition you want to set the environment variable CI to true, in order for Jest to run all tests:

ci_true

With these things in place your build should now include test results and coverage reports!

The SOSI-format: The crazy, Norwegian, geospatial file format

Imagine trying to coordinate the exchange of geospatial data long before the birth of the Shapefile, before XML and JSON was thought of. Around the time when “microcomputers” was _really_ new, and mainframes was the norm. Before I was born.

Despite this (rather sorry) state of affairs, you realize that the “growing use of digital methods used in the production and use of geospatial data raises several coordiantion-issues” [my translation]. In addition, “there is an expressed wish from both software companies and users of geospatial data that new developments does not lead to a chaos of digital information that cannot be used without in-depth knowledge and large investments in software” [my translation].

Pretty forward-thinking if you ask me. Who was thinking about this in 1980? Turns out that two Norwegians, Stein W. Bie and Einar Stormark, did this in 1980, by writing this report.

This report is fantastic. It’s the first hint of a format that Norwegians working with geospatial data (and few others) still has to relate to today. The format, known as the “SOSI-Format” (not to be confused with the SOSI Standard) is a plaintext format for representing points, lines, areas and a bunch of other shapes, in addition to attribute data.

My reaction when I first encountered this format some 8 years ago was “what the hell is this?”, and I started on a crusade to get rid of the format (“there surely are better formats”). But I was hit by a lot of resistance. Partly because I confused the format with the standard, partly because I was young and did not know my history, partly because the format is still in widespread use, and partly because the format is in many ways really cool!

So, I started reading up on the format a bit (and made a parser for it in JavaScript, sosi.js). One thing that struck me was that a lot of things I’ve seen popping up lately has been in the SOSI-format for ages. Shared borders (as in TopoJSON) Check! Local origins (to save space) Check! Complex geometries (like arcs etc) Check!

But, what is it like? It’s a file written in what’s referred to as “dot-notation” (take a look at this file and you’ll understand why). The format was inspired by the british/canadion format FILEMATCH and a french database-system called SIGMI (anyone?).

The format is, as stated, text (i.e. ASCII) based, with the reason was that this ensured that data could be stored and transferred on a wide range of media. At the time of writing the report, there existed FORTRAN-implementations (for both Nord-10/S and UNIVAC 1100) for reading and writing. Nowadays, there exists several closed-source readers and writes for the format (implemented by several Norwegian GIS vendors), in addition to several Open Source readers.

The format is slated for replacement by some GML-variation, but we are still waiting. There is also GDAL/OGR support for the format, courtesy of Statens Kartverk. However, this requires a lot of hoop-jumping and make-magic on Linux. In addition, the current implementation does not work with utf-8, which is a major drawback as most .SOS-files these days are in fact utf-8.

So, there we are. The official Norwegian format for exchange of geographic information in 2018 is a nearly 40 year old plain text format. And the crazy thing is that this Norwegian oddity is actually something other countries are envious about, as we actually have a common, open (!), standard for this purpose, not some de-facto reverse-engineered binary format.

And, why indeed, why should the age of a format be an issue, as long as it works?

The Open Geospatial Data Ecosystem

This summer my first peer-reviewed article, “The Open Geospatial Data Ecosystem”, was published in “Kart og plan”. Unfortunately, the journal is not that digital, and they decided to withhold the issue from the web for a year, “in order to protect the printed version”. What?!

However, I was provided a link to a pdf of my article, and told I could distribute it. I interpret this as an approval of me publishing the article on my blog, so that is exactly what I’ll do.

The full article can be downloaded here: http://docs.atlefren.net/ogde.pdf, and the abstract is provided here:

Open Governmental Data, Linked Open Data, Open Government, Volunteered Geographic Information, Participatory GIS, and Free and Open Source Software are all parts of The Open Geospatial Data Ecosystem. How do these data types shape what we define as Open Geospatial Data; Open Data of a geospatial nature? While all these areas are well described in the literature, there is a lack of a formal definition and exploration of the concept of Open Geospatial Data as a whole. A review of current research, case-studies, and real-world examples, such as OpenStreetMap, reveal some common features; governments are a large source of open data due to their historical role and as a result of political pressure on making data public, and the large role volunteers play both in collecting and managing open data and in developing open source tools. This article provides a common base for discussion. Open Geospatial data will be even more important as it matures and more governments and corporations release and use open data.

Prosjektbeskrivelse i boks

Ting tar tid. I høst fikk jeg beskjed om at jeg måtte levere inn en formell prosjektbeskrivelse av PhD-prosjektet mitt til doktorgradsutvalvet ved IVT. Det endte opp med at jeg fikk levert denne 18. april, og 2. mai var den blitt behandlet. Hyggelig melding der:

Doktorgradsutvalget godkjenner den endelige prosjektbeskrivelsen for ph.d.-avhandlingen til Atle Frenvik Sveen

Men hva er en prosjektbeskrivelse? Det sier seg vel igrunn selv? Mer spesifikt er det en beskrivelse av bakgrunn, mål, omfang (og begrensninger), metode, etiske vurderinger, forventede resultater, og en plan for arbeidet. For meg virker det litt søkt å skulle svare så mye i detalj før jeg er skikkelig i gang, men jeg skjønner jo at man må reflektere litt. Jeg vet ikke helt om dette dokumentet regnes som offentlig materiale, men jeg tenker nå uansett å sakse det “viktigste” innholdet her, sånn for å gi en oversikt over hva jeg driver med.

I bakgrunns-delen går jeg inn på hva som har blitt gjort tidligere, og snakker om hva som gjør at dette arbeidet er relevant:

Geospatial Data has been created and managed since the first maps where made (Garfield, 2013). The impact of the digital revolution on this field have far-ranging consequences. A map is but one of several representations of the underlying digital data. The digitalization of the map-making process thus involves several shifts. One is the de-coupling of the printed map from the actual data, another is the fact that geospatial data can be used for more than printing maps.

Open Data is another consequence of digitalization. There is an increasing political pressure to make digital data produced and maintained by governments available to the public (Cox & Alemanno, 2003; Ginsberg, 2011; Yang & Kankanhalli, 2013). Political accountability, business opportunities, and a more general trend towards openness are all cited as reasons behind this movement (Huijboom & Broek, 2011; Janssen, Charalabidis, & Zuiderwijk, 2012; Sieber & Johnson, 2015). In practice this means that geospatial data from a range of sources are becoming available for everyone to use for whatever purpose they see fit.

A third trend is crowdsourcing, or Volunteered Geographic Information (VGI) (Goodchild, 2007). This concept bears some resemblance to Free and Open Source Software. The underlying concept is that amateurs collaborate on tasks such as writing online encyclopedias, writing computer software, or, as in the case of geospatial data, create a database of map data covering the world: OpenStreetMap (OSM) (Haklay & Weber, 2008).

What is lacking is a combined overview and a set of best practices. What characterizes a system built to handle an automated gathering of geospatial data published in a myriad of formats, with different metadata standards (or no metadata at all), with different update frequencies, and different licenses? A thorough investigation of these problems will enable a better understanding of what data is of interest, how it should be shared, and how the promised value of Open Geospatial Data can be extracted.

Målene oppsummerer jeg ganske enkelt slik:

The overall objectives of this project are (1) to establish guidelines on how to store and manage geospatial data from disparate sources, with different structure and quality, and (2) to explore how this data can be utilized for value generation and decision support. The overarching theme of both objectives are how the Open Source mindset can be utilized.

Når det gjelder forventede resultater summerer dette det meste ganske greit opp:

There are two main results we hope to obtain from this project. The fist is a better understanding of how geospatial data can be gathered from disparate sources and stored in an efficient manner that can be utilized. The other main result is to find new areas, products, and methods that be carried out by using this data. Establishing systems for assessing quality and fitness for use of the data is also an important aspect.

Hvis du er interessert i å lese hele prosjektbeskrivelsen finner du den her: phd_prosjektbeskrivelse_atlefren.