Category Archives: Geomatikk

How’s the PhD going?

“Don’t ask”

“There is light at the end of the tunnel, but I’m not sure if it’s a train”

“Well, at least it’s not going backwards”

“Let’s talk about something else, shall we?”

All these are perfectly valid responses to the above question. They are more polite than “none of your business” and all contains a grain of truth.

However, in the interest of a few (zero), I thought as well I might share some details here. Mainly motivated by the fact that in a couple of months I’ve managed to get two articles published. Which is kinda a big deal.

So, what’s been published then?

First there is “Micro-tasking as a method for human assessment and quality control in a geospatial data import“, published in “Cartography and Geographic Information Science” (or CaGIS). This article is based on Anne Sofies Master thesis, but has been substantially reworked in order to pass a scientific article. The premise is quite simple: How can microtasking be used to aid in an import of geospatial data to i.e. OpenStreetMap. Or, as the abstract puts it:

Crowd-sourced geospatial data can often be enriched by importing open governmental datasets as long as they are up-to date and of good quality. Unfortunately, merging datasets is not straight forward. In the context of geospatial data, spatial overlaps pose a particular problem, as existing data may be overwritten when a naïve, automated import strategy is employed. For example: OpenStreetMap has imported over 100 open geospatial datasets, but the requirement for human assessment makes this a time-consuming process which requires experienced volunteers or training. In this paper, we propose a hybrid import workflow that combines algorithmic filtering with human assessment using the micro-tasking method. This enables human assessment without the need for complex tools or prior experience. Using an online experiment, we investigated how import speed and accuracy is affected by volunteer experience and partitioning of the micro-task. We conclude that micro-tasking is a viable method for massive quality assessment that does not require volunteers to have prior experience working with geospatial data.

This article is behind the famous scholarly paywall, but If you want to read it we’ll work something out.

What did I learn from this? Well, statistics is hard. And complicated. And KEEP ALL YOUR DATA! And the review process is designed to drain the life our of you.

The second article was published a couple of days ago, in “Journal of Big Data”. Its’s titled “Efficient storage of heterogeneous geospatial data in spatial databases“, and here I am the sole author. The premise? Is NoSQL just a god-damn fad for lazy developers with a fear of database schemas? The conclusion? Pretty much. And PostGIS is cool. Or, in more scholarly terms:

The no-schema approach of NoSQL document stores is a tempting solution for importing heterogenous geospatial data to a spatial database. However, this approach means sacrificing the benefits of RDBMSes, such as existing integrations and the ACID principle. Previous comparisons of the document-store and table-based layout for storing geospatial data favours the document-store approach but does not consider importing data that can be segmented into homogenous datasets. In this paper we propose “The Heterogeneous Open Geodata Storage (HOGS)” system. HOGS is a command line utility that automates the process of importing geospatial data to a PostgreSQL/PostGIS database. It is developed in order to compare the performance of a traditional storage layout adhering to the ACID principle, and a NoSQL-inspired document store. A collection of eight open geospatial datasets comprising 15 million features was imported and queried in order to compare the differences between the two storage layouts. The results from a quantitative experiment are presented and shows that large amounts of open geospatial data can be stored using traditional RDBMSes using a table-based layout without any performance penalties.

This article is by the way Open Access (don’t as how much that cost, just rest ensured that in the end it’s all taxpayer money), so go ahead and read the whole thing if this tickles your fancy. An there is Open Source code as well, available here: github.com/atlefren/HOGS. Some fun facts about this article:

  • I managed to create a stupid acronym: HOGS
  • The manuscript was first left in a drawer for five months, before the editor decided it wasn’t fit for the journal

The next journal provided such great reviews as

If you are importing a relatively static dataset such as the toppological dataset of Norway does it really matter if the import takes 1 hr 19 mins vrs 3 hours? It is very likely that this import will only be performed once every couple of months minimum. A DB admin is likely to set this running at night time and return in the morning to an imported dataset.

and

You are submitting your manuscript as “research article” to a journal that only cares about original research and not technical articles or database articles. For this reason, you need to justify the research behind it. The current state of the paper looks like a technical report. Again, an interesting and well-written one, but not a research article.

And the last reviewer (#2, why is it always reviewer #2?) who did not like the fact that I argued with him instead of doing what he said, and whose last comments was that I should add a section: “structure of the paper”. Well, I like the fact that some quality control is applied, but this borders the ridiculous.

Well, so there you have it three articles down (this was the first), at least one to go.

Speaking of. The next article is in the works. I’ve written the code, started writing the article and am gathering data to benchmark the thing. I need versioned geospatial data, and after a while I found out that OpenStreetMap data fits the bill. After some failed attempts using osm2pgsql and FME (which both silently ignore the history), I had to roll my own. Osmium seemed like it could do the trick, but by C++-skills are close to non.existent. Fortunately there is pyosmium, a Python wrapper. After spending a lot of time chasing memory leaks, I found that osmium is _really_ memory-hungry. So, using a cache-file might do the trick. I might do a write-up on this process when (if?) it finishes, but if you’re interested the source code is available on GitHub.

So, yeah. Thats it for now, check back next decade for the next update!


The SOSI-format: The crazy, Norwegian, geospatial file format

Imagine trying to coordinate the exchange of geospatial data long before the birth of the Shapefile, before XML and JSON was thought of. Around the time when “microcomputers” was _really_ new, and mainframes was the norm. Before I was born.

Despite this (rather sorry) state of affairs, you realize that the “growing use of digital methods used in the production and use of geospatial data raises several coordiantion-issues” [my translation]. In addition, “there is an expressed wish from both software companies and users of geospatial data that new developments does not lead to a chaos of digital information that cannot be used without in-depth knowledge and large investments in software” [my translation].

Pretty forward-thinking if you ask me. Who was thinking about this in 1980? Turns out that two Norwegians, Stein W. Bie and Einar Stormark, did this in 1980, by writing this report.

This report is fantastic. It’s the first hint of a format that Norwegians working with geospatial data (and few others) still has to relate to today. The format, known as the “SOSI-Format” (not to be confused with the SOSI Standard) is a plaintext format for representing points, lines, areas and a bunch of other shapes, in addition to attribute data.

My reaction when I first encountered this format some 8 years ago was “what the hell is this?”, and I started on a crusade to get rid of the format (“there surely are better formats”). But I was hit by a lot of resistance. Partly because I confused the format with the standard, partly because I was young and did not know my history, partly because the format is still in widespread use, and partly because the format is in many ways really cool!

So, I started reading up on the format a bit (and made a parser for it in JavaScript, sosi.js). One thing that struck me was that a lot of things I’ve seen popping up lately has been in the SOSI-format for ages. Shared borders (as in TopoJSON) Check! Local origins (to save space) Check! Complex geometries (like arcs etc) Check!

But, what is it like? It’s a file written in what’s referred to as “dot-notation” (take a look at this file and you’ll understand why). The format was inspired by the british/canadion format FILEMATCH and a french database-system called SIGMI (anyone?).

The format is, as stated, text (i.e. ASCII) based, with the reason was that this ensured that data could be stored and transferred on a wide range of media. At the time of writing the report, there existed FORTRAN-implementations (for both Nord-10/S and UNIVAC 1100) for reading and writing. Nowadays, there exists several closed-source readers and writes for the format (implemented by several Norwegian GIS vendors), in addition to several Open Source readers.

The format is slated for replacement by some GML-variation, but we are still waiting. There is also GDAL/OGR support for the format, courtesy of Statens Kartverk. However, this requires a lot of hoop-jumping and make-magic on Linux. In addition, the current implementation does not work with utf-8, which is a major drawback as most .SOS-files these days are in fact utf-8.

So, there we are. The official Norwegian format for exchange of geographic information in 2018 is a nearly 40 year old plain text format. And the crazy thing is that this Norwegian oddity is actually something other countries are envious about, as we actually have a common, open (!), standard for this purpose, not some de-facto reverse-engineered binary format.

And, why indeed, why should the age of a format be an issue, as long as it works?

Testing Geospatial claims using Qgis, CartoDB and Cesium.js

andersnatten
This summer I hiked to Andersnatten, a rather small mountain in the southeast of Norway. On the start of the trail there was a sign, that among other things, said that you can see 7 parishes from the top. When we reached the top we had a great view, but I couldn’t see any parishes.. That is, I have no idea where the parishes are, so I couldn’t refute or confirm the claim.

Beeing a geospatial geek I thought that this should be possible to remedy. I just needed the Parishes as polygons, and then I could do some analysis. Well, turns out that I couldn’t find any georeferenced parishes. The closes I got was these scanned paper maps. I couldn’t let this stop me, so I opened Qgis and set to work. Luckily the parish borders resembles modern day municipality borders rather close, so with the georeferenced paper maps, and some other Qgis magic (perhaps more on this in a later blog post) I managed to digitize all the 315 parishes from 1801.

I then loaded these digitized parish polygons into cartodb, and colored the ones around Sigdal, the parish where Andersnatten is. The map turned out like this:

With this in place it was rather certain that 7 was a reasonable amount, there are 6 parishes sharing a border with Sigdal, these should be see-able. According to this article “Dust, water vapour and pollution in the air will rarely let you see more than 20 kilometres (12 miles), even on a clear day.”

Ok, 20 km, lets see how close the 7 nearest parishes are to Andersnatten, using a PostGIS query in Cartodb:

SELECT 
	name,
	ST_Distance(
      the_geom::geography,
      ST_SetSRID(
        ST_MakePoint(9.41677103, 60.11744509),
        4326
      )::geography) / 1000 as dist
FROM prestegjeld
ORDER BY dist
LIMIT 7

This gives

Sigdal      0
Rolloug     5.818130882558
Flesberg    13.510679336426
Modum       19.686924594812
Næss        20.103683955646
Nordrehoug  22.199498534301
Tind        24.804343832136

Ok, so the farthest parish of the seven are 24 kms away, give us some leeway since we are on a 733 m high peak. Interestingly, the closes ones doesn’t overlap with neighboring parishes.

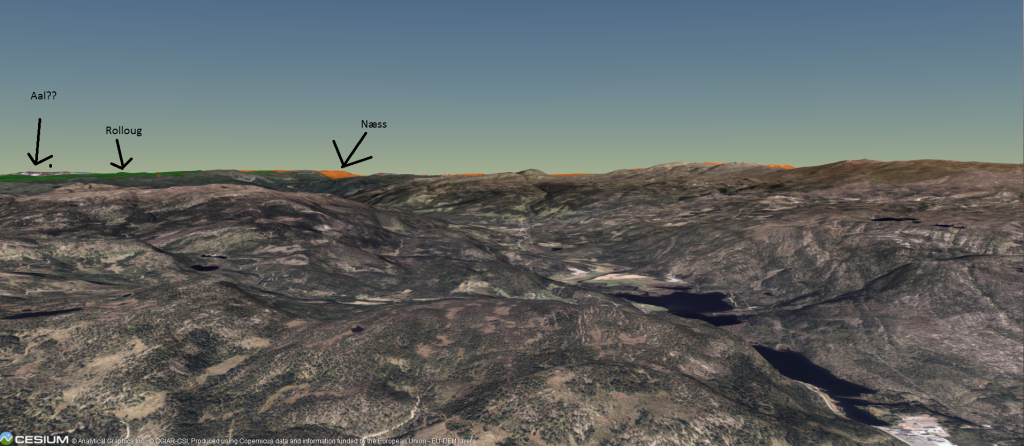
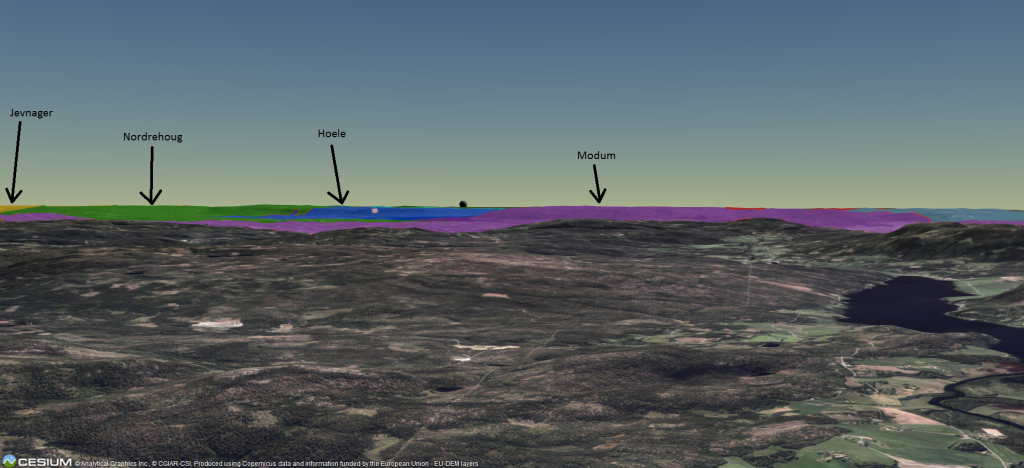
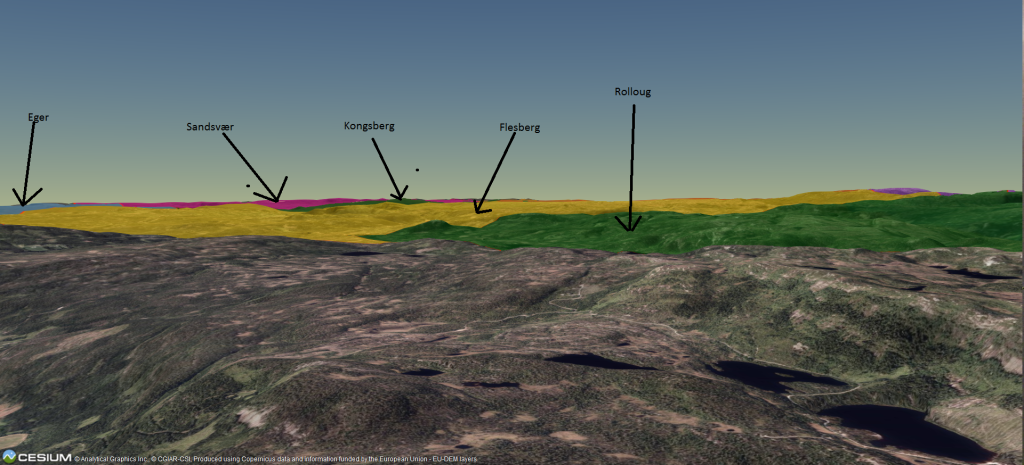
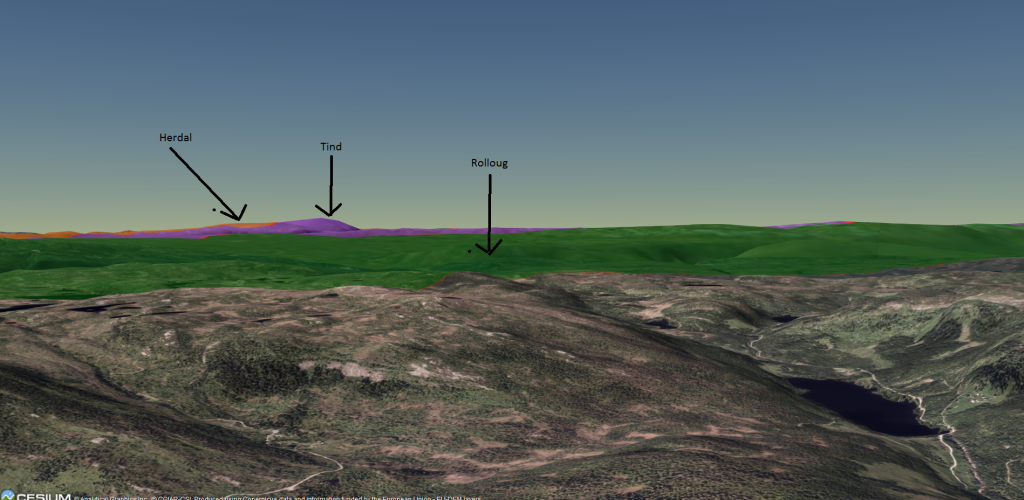
Ok, but, line of sight? What if there are other mountains blocking the view? Since I’m already working on a Cesium.js project I decided to add the CartoDB map to a 3d Model and do some visual tests.

View North
View North

View Southeast
View Southeast

View South
View South

View West
View West

Oh, that’s a suprise. Ok, Cesium does not add “dust, water vapour or air pollution”, and the height model might be a bit off, but nonetheless: 13 (possibly 14) parishes can be seen in this model! That is double the number stated on the sign! Guess they have backing for their claim after all!

Oh, by the way: the digitized parishes are available at GitHub

Ølkart på #hack4no

Jeg var med på #hack4no hos Kartverket på Hønefoss i helga. Da jeg satt på toget til Drammen fikk jeg en Twitter-melding:

Det viste seg at mitt bidrag: Ølkart, vant i kategorien “Beste løsning med geografiske data”, noe som jo er veldig gøy! Jeg tenkte jeg her skulle gå litt igjennom løsningen, hvordan den er blitt til og litt tanker videre.

Men, først av alt: Løsningen finner du på http://beermap.atlefren.net. Det er, som jeg skriver på siden, en: “Visualisering og søk i norske bryggerier, barer og polutsalg.” Koden ligger (så klart) på GitHub

Jeg meldte meg på hack4no mest fordi jeg tenkte det var et bra sted å møte kjente i #geomatikk-miljøet, samt at Kulturdirektoratet, som jeg jobber for for tiden er med på organisator-siden.

Jeg holdt et foredrag på formiddagen fredag om prosjektet jeg gjør for kulturrådet, med fokus på koden du finner på GitHub. Jeg hadde igrunn tenkt at jeg skulle bruke mye av tiden min på å hjelpe andre med å bruke Norvegiana-data, samt å bruke API-wrapper-prosjektet vårt, og hadde tenkt fint lite på selve konkurransen. Folk spurte meg om hva jeg skulle jobbe med, og jeg svarte at “jeg må vel gjøre noe med øl”, mest på spøk.

Dog, jeg satt meg ned i fem minutter, og tenkte litt og kom opp med en tankeskisse som inneholdt følgende: https://github.com/atlefren/norwegian-breweries. Det var vel igrunn det eneste som sto på lista da jeg gikk i gang. Så det første jeg gjorde var jo å lage et kart som viste disse bryggeriene. Ikke veldig spennende, ei heller noe vinneroppskrift. Så fant jeg ut at jeg kunne legge inn mer, Vinmonopolet har jo et “API” med butikkene sine, riktignok på et CSV-format fra helvette, men det fungerte, og jeg fikk også disse inn i kartet. Så hentet jeg puber fra OSM, jeg prøvde først med overpass APIet, men det var så komplekst at jeg valgte å bruke en nedlastet shapefil fra geofabrik, der jeg filtrerte ut puber.

Dette tok vel en god del av ettermiddagen fredag, ispedd en del spørsmål om KNreise og mye CSS-dilling. Etterhvert innså jeg at jeg burde kanskje få inn noe offentlige data ut over bakgrunnskart fra Kartverket, og bestemte meg for å legge inn addresesøket til Kartverket, noe som igrunn var en smal sak. Dette kom på plass i kartet, og jeg funderte litt på hva jeg skulle gjøre videre. Svaret ble å fokusere på lokasjon, dvs å finne nærmeste pol/pub/bryggeri. Geolocation i HTML5, kombinert med addressesøk, ble svaret her, og jeg hadde etterhvert en fin visning av 10 nærmeste. En utfordring var at jeg ikke hadde noen database i bak-kant, alle dataene ble lest inn i minnet i flask/Python-appen min fra GeoJSON. Dog, det finnes bibliotek for Haversine-avstandsberegning.

Det neste ble veldig naturlig å ruteberegne fra din posisjon til bryggeriene, og jeg lurte litt på om jeg skulle bruke Norkarts ruteberegner Ferd, Mapbox sin, eller kanskje Google sin. Jeg snakket med noen som nevnte at Vegvesenet stilte sin ruteberegner til disposisjon under hacket, noe jeg tenkte at var mest i ånden å bruke da. Denne hadde dog sine utfordringer: Mangel på CORS-støtte, krøkkete autentisering, kun UTM33, samt Esri JSON-format. Alt lot seg løse, men det hadde vært penere med GeoJSON i latLon!

Da denne biten var på plass hadde klokka nærmet seg ett på natta, men jeg var inne i en god flyt. Jeg brukte noe tid på å refaktorere det som hadde blitt ei jQuery-suppe, men gav fort opp det. Så ble det brukt noe tid på stiling av kart og markører, men heller ikke dette er noe jeg synes er dritgøy.

Dermed fant jeg ut at jeg måtte ha inn PostGIS, så jeg brukte noe tid på å få på plass dette. Det gikk overaskende smertefritt, men tok jo noe tid. En naturlig følge av å ha en romlig database var jo å kjøre noe spørringer, så jeg fikk inn kommunepolygoner og begynnte å aggregere. Da fant jeg fort ut at jeg skulle lære meg litt D3, så jeg fant en tutorial og gikk i gang. Fikk etter relativt kort tid spytta ut noe grafer, og sa meg fornøyd.

Jeg følte fortsatt at det var litt lite geohipster-preg over løsninga mi, men da klokka nærma seg seks på mårran og jeg innså at det nok ikke ble noe søvn, kom jeg på at Alex hadde blogga om hexagoner i POstGIS, heldigvis med kode. Litt tweaking senere hadde jeg et hexmap! Det gir kanskje ikke så mye innsikt, men det er kult!. Innen dette var på plass nærma det seg frokost, samt at jeg var ute en gåtur i drittværet for å bunkre snus. Timene etterpå ble brukt til å snekre sammen en presentasjon, samt å være litt i koma. Etter presentasjonen min fant jeg ut at grafene mine kunne bli bedre hvis jeg fikk inn befolkningsdata, og jeg rota meg inn på SSB sine sider. Mye data, men mye tullete formater, og mer CSV-krangling med Python. Vel, fikk det jo dataene på plass etterhvert, men det ble mye jobb.

Da grafene mine begynte å bli presentable la jeg ut et screenshot av dem på en ølnerdeside på Facebook, og fikk litt tilbakemelding på at bryggerilista jeg baserte meg på var rimelig utdatert. Det førte til at jeg innså at jeg måtte ha en funksjon for å opprette, endre og slette bryggerier. Dette tok en del tid, og ikke før i halv-fire-tida hadde jeg i det minste oppretting på plass. Det betød at jeg hadde en halvtime på meg for å lage en presentasjon eller “Pitch”. Heldigvis er Big veldig raskt å lage presentasjoner i, og jeg fikk bare 3 minutter.

Klokka fire var det tid for presentasjon, og jeg var førstemann ut. Det gikk rimelig greit synes jeg, men etter å ha sett alle de andre gruppene presentere (jeg var tydeligvis den eneste som jobbet alene), tenkte jeg at “dette vinner jeg ikke, jeg er for useriøs”. Jeg sjekket togtider til Drammen, og så at det gikk et tog 18.00, og neste 21.00. Foreldrene mine fristet med øl og spekemat, så det ble 18.00-toget! Dermed fikk jeg ikke med meg kåringen, men fikk beskjed via Twitter. Kjempekult! Jeg hadde omtrent ikke fått med meg hva premien var, og hadde nesten ikke tenkt å presentere noe, så det var kult.

Ikke bare var det kult å vinne, men det var kult å være med også! Mye flinke folk, mye gode inspill og mye spørsmål. Jeg hjalp folk med alt fra Python-kode til KNreise-apier, og fikk innspill på både datasett, løsninger og rammeverk. I tillegg fikk jeg snakket med mye folk, og ikke minst fikk jeg sitti i nærmere 24 timer og skrevet kode! Knall helg, knall arrangement. Jeg blir gjerne med til neste år.

Men, hva har jeg lært etter mitt første hackaton? Jeg kan vel ikke påstå at jeg har noen fasit, men min oppskrift på seier var vel følgende:

  • Jobb med noe du kan fra før, hvis ikke bruker du mye tid på elementære ting (ref D3)
  • Jobb med noe du synes er gøy
  • Drit i å tenke: Gjør noe!
  • Aksepter at du kommer til å lage spaghetti-kode!
  • YAGNI for alle penga
  • Lag en god presentasjon/pitch.
  • Fokuser på å ha det gøy, ikke på seier
  • For meg funka det bra å jobbe aleine, mye koordinering man slipper
  • Bruk open source bibliotek der du kan, det sparer mye tid
  • Snakk med folk, få innspill

GIS Programming: languages breakdown

Yesterday i found this post on geoawesomeness, with the intriguing headline “Learning GIS programming: An overview”. After reading it I felt a bit disappointed though. It was basically a breakdown of different programming languages and their usages in the GIS field. While this in itself is a good thing, I think it left a great deal out and confused some. Then I thought “well, instead of complaining, do it better yourself!”.

So here we go, my breakdown of some selected programming languages, their usages in the GIS field, along with notable examples and libraries. I’m ordering the languages roughly by age. Bear in mind that I was born in the 80ies, so your favourite language from before 2000 might not make it to the list if it’s not around anymore.

Fortran
This may be the exception to the previous statement, but Fortran is still around, I’ve even programmed in Fortran.

Fortran is an imperative language, the first compiled language, dated back to 1957. It’s still used today in numerical computations, but in the GIS field it’s largely legacy code that still is in Fortran. The only example I can think of is a set of geodesic functions we used at the university: Holsen’s småprogrammer.

Unless you know Fortran by heart and like working with legacy code you can safely ignore this language.

C/C++
C and C++ is actually two different languages, or: C++ is a superset of C with object oriented capabilities, while C is an imperative language. They date from 1970/1980, and since I don’t really know these languages I’ll treat them like the same. My impression is that they are rather “down to the metal”, you have pointers, memory management and stuff like that.

Unlike Fortran, C/C++ is still in widespread use, in the GIS-field it’s being used for several desktop applications of some age, as well as in what I’ll call the “first wave” of open source libraries and utilities. Notable mentions are PostGIS, OGR/GDAL, PROJ.4 and Mapserver.

While you may now know C/C++ and never really write a line of code in it, you will be using some tools written in it, either as a database, through the command line or through language bindings.

Java
Java is an object-oriented, multi-purpose language from 1995. It was originally developed by SUN. It’s become known for it’s rather “enterprisy” libraries, with several layers of abstractions and other strange things. Despite this, the language has gained widespread use, although it’s prime time may be past, although Java is the programming language for Android apps.

Java libraries was the “second wave” of open source GIS, and brought us libraries and tools like GeoServer, GeoTools, JTS and GeoWebCache.

Just because of GeoServer I think you should know some Java to get along as a GIS-developer. GeoServer has support for plugins, written in Java. This means that mastering Java you will be able to extend GeoServer to your needs. Java is not all that difficult in itself, but Java-code tends to be bogged down in layers of abstraction as mentioned earlier.

C#
C# is, in a way, Microsofts version of Java. It’s object oriented at it’s core, and a multi purpose language. Released in 2000 it’s gained a large following in “Microsoft shops”, and it’s way better than anything Microsoft has previously made. The language itself is rather nice, but suffers from some of the same enterprisyness as Java, and the tooling is completely tied to Microsoft (Visual Studio and the like) if you stick with the .NET-platform (as most do).

This may be the reason why the open source community hasn’t embraced C#, but there are some ok-ish libraries, mainly NetTopologySuite and some ports of Proj.4. At least in Norway you’ll have to be a good navigator to avoid C# and .NET, it seems to be the preferred language and platform for several consultancies, software houses and governmental bodies.

Python
Python is a multi-paradigm, dynamically typed language focused on readability. It’s not the fastest language around, but can use C/C++ bindings to speed up things.

Python has been adopted by ESRI as the scripting language of choice for their ArcGIS-platform, as well as by QGIS, where you have access to a python REPL and can write plugins using Python. There are also other GIS-libraries for Python, mainly Shapely, Fiona and Rasterio, as well as several other tools. On the applications side there is the tile server MapProxy and several other utilities.

Python is a really great programming language in itself, easy to grasp, enforces clean, readable code, and with the usage both in ESRI and QGIS it’s a language that you most definably should know it you work with GIS.

JavaScript
JavaScript was once known as the programming language for web browsers, and was regarded as clumsy, difficult and a toy language. That’s changed a bit the last years, with better tooling and some improvements to the language itself, but it still is a dynamic language with both parts object orientation and functional programming sides to it. The rise of Node.js also made JavaScript a general-purpose language, and this constitutes the “third wave” of open source GIS-libraries if you ask me.

From the advent of Google Maps and OpenLayers, JavaScript found it’s place in the GIS-domain as the language to write web map clients in (that is, after people realized that Flash and Sliverlight where blind alleys). Now there is a large ecosystem of browser-libraries, such as OpenLayers 2 & 3, Leaflet, mapbox-gl-js, proj4js and several more.

As for Node.js, this has been adopted by the “geohipster”-company Mapbox, which uses JavaScript for several parts of their server-stack, resulting in open source libraries such as Turf.js.

Again, JavaScript is really a language to focus on if you plan on doing any web-related GIS-work at all. Just don’t think you know JavaScript because the syntax is close to that of Java/C#, and do take your time to dig in to the functional sides of the language. And stay clear of Angular.js, unless you really like enterprisy code! JavaScript still has it’s quirks, and there are released several new frameworks, tools and libraries each day, so you may find this language a bit confusing.

These are mainly the languages that are used today as far as I know, but there are some other languages that might be worth looking into, namely:

Swift/Objective-C: Used for app development on the Apple platform, I really don’t know anything about this, but there gotta be some libraries, as there are maps both on iPhones and iPads.

Go Is a relatively new language from Google, perhaps described as C for the new century? I’ve never used it, but I wan’t to use it as I know several people who really seem to like it. As for GIS-libraries I’m not sure, but I believe there are wrappers for OGR/GDAL and Proj.4 available.

Clojure Is a Lisp-implementation using the JVM. It’s really functional programming, a style which I’ve been attracted to the last year or so, although I haven’t used Clojure at all, and I do not know if there are any GIS-libraries available, but hopefully?

There are probably a dozen more languages that could be included in this list, like Scala, Groovy, Ruby or PHP, but I really don’t know them at any depth, and I’m not sure about how they stack up when it comes to GIS. If you do know, drop me a comment!